We all hear good news on Covid-19 vaccines, they keep going well, and everyone waiting to see the light at the end of the tunnel - it was such a time!! Without question, this forced everyone to work from home, at least for some time, whether they like it or not.
I hear both pro and con comments on working from home, and I wondered how this situation affected information sharing and problem resolutions in software development. Suppose you are in an office, whenever in dought, just raising the head and asking a question solves most of them. However, when working remotely, though you have all the communication tools, I thought it is not easy to solve a question in the same way, for the context is not the same for all.
When looking for some data to see the trends, what first came to mind was Stack Overflow. It is the defacto place to go for software development questions these days, and it has a fantastic API. The API lets you get a variety of data, and it has a simple web interface to test your REST queries.
Quickly settle down on Python to do this for its visualization capabilities though this will be a simple graph. I played around with Visual Studio Code for no particular reason (while I use Visual Studio already) and found that its support for jupyter notebooks is excellent.
I wanted to get the number of questions submitted for a few categories per month, including OpenSource tools, proprietory and things in between. Making requests and get data from JSON response was a piece of cake with Python, but soon it failed with an error 'Throttling violation'. I briefly saw in documentation that there was a limit for anonymous requests (I made anonymous requests as this is a one-off thing), which suppose to be 10000 requests. At the same time, there is yet another restriction that you can't make more than 30 requests per second.
I was not going anywhere near 10000 requests, but they sent from a list comprehension in Python, like
azure = [getDataFromSE(start, end, 'azure') for (start, end) in zip(data['utc_start'], data['utc_end'])]
I wondered if it sent all the requests without waiting for the result and violated the 30 req/sec limit, but slowing it down didn't work; I had to wait till the next day to get the quota to reset. Further research showed that the limit is somewhere around 300 requests per day for anonymous requests, and I had just passed it when I got the error. Probably 10000 is internal requests, and API certainly makes more internal requests for each REST request.
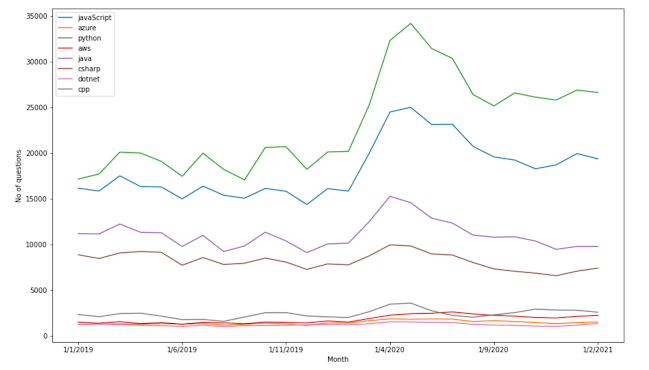
I exported data to CSV, so continuing and getting all the data the next day was easy. Following is the final graph I got.
It went up around early days but came down after a few months, and for some categories, the increase is minuscule.
It isn't easy to see why they dropped reasonably fast, but I thought it is an interesting fact ....

No comments:
Post a Comment